Electric Vehicle Spatial Analysis with R
Utilizing Geographic Weighted Regression to Examine Electric Vehicles and Charging Stations in the U.S.
Team Members:
Pilar Delpino
Mingshuang Lian
Jess Strzempko
Caroline Williams
Advisors:
Lyndon Estes (Professor)
Affiliation:
Clark University
Course:
GEOG 346: Geospatial Analysis with R
Team Members:
Pilar Delpino
Mingshuang Lian
Jess Strzempko
Caroline Williams
Advisors:
Lyndon Estes (Professor)
Affiliation:
Clark University
Course:
GEOG 346: Geospatial Analysis with R
Project Description:
This project was accomplished alongside other MS GIS students at Clark University: Pilar Delpino, Mingshuang Lian, and Jess Strzempko. The New York Analysis was completed as my part of the final project in Geospatial Analysis with R. Other members worked on different locations and used varying methodologies.
Research Question:
Is Electric Vehicle (EV) Usage and Accessibility in the United States Just and Equitable?
Introduction:
This project examines the accessibility of electric vehicle (EV) usage in the United States through the lens of justice and equity. Accessibility is measured through monetary value, distance, and access to charging stations. Social justice and equity is quantified using:
(1) socioeconomic data and its correspondence to the spatial distribution of EV ownership through car registrations;
(2) and identifying gaps in service provision.
This project examines these dynamics at both the national scale and state level. State-specific analysis will be conducted on California and New York as their data is highly publicly available for this field of study.
Project Question:
1. How just is the access to electrified mobility?
2. How even is the spatial distribution of charging stations throughout the United States?
3. Who has access to electrified mobility and benefits from EV infrastructure growth?
Data:
Maps:
New York State Analysis
As a comparative analysis, New York was one of two states chosen to illustrate state-level trends and relationships with electric vehicles, charging stations and socioeconomic factors. ACS and NYSERDA were utilized for socioeconmic and EV/CS variables respectively. Using Geographic Weighted Regressions for Electric Vehicle registrations and Charging stations, we are able to ask, how accessible are electric vehicles and charging stations in relation to various socioeconomic variables? In addition to the GWR Analysis, this question is further explored through summary statistics, exploratory analyses, correlation and collinearity tests, and spatial autocorrelation of the GWR outputs using Moran's I.
New York State Results
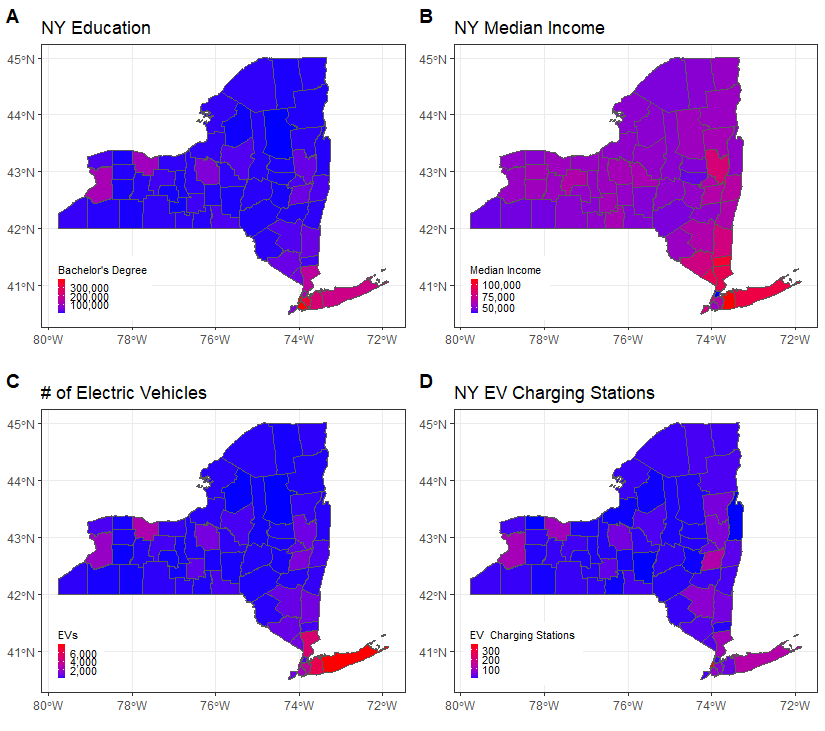
Summary statistics of total electric vehicle (EV) and charging stations (CS) per county resulted in a median of 9 EVs and 12 CS per county. While these medians are close in value, there is a larger difference in the maximum values of EV and CS with 46,842 and 355 respectively. Additional statistical results show the top 5 counties for percentage of electric vehicles and percentage of charging stations per county. Only one county, Ulster County, experiences both high EV and CS percentages being the fourth greatest county with Electric Vehicle registrations (44%) and fifth largest county in Charging Stations (4%).
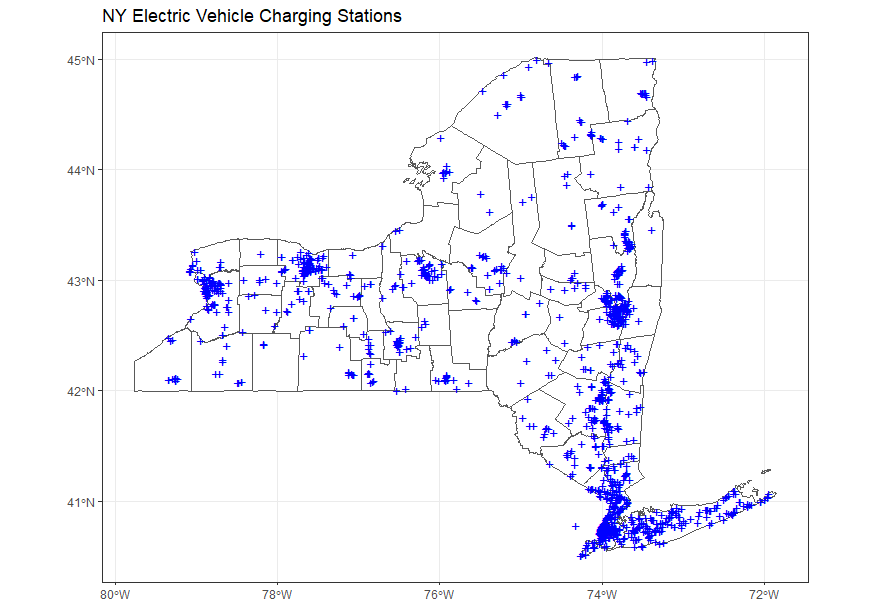
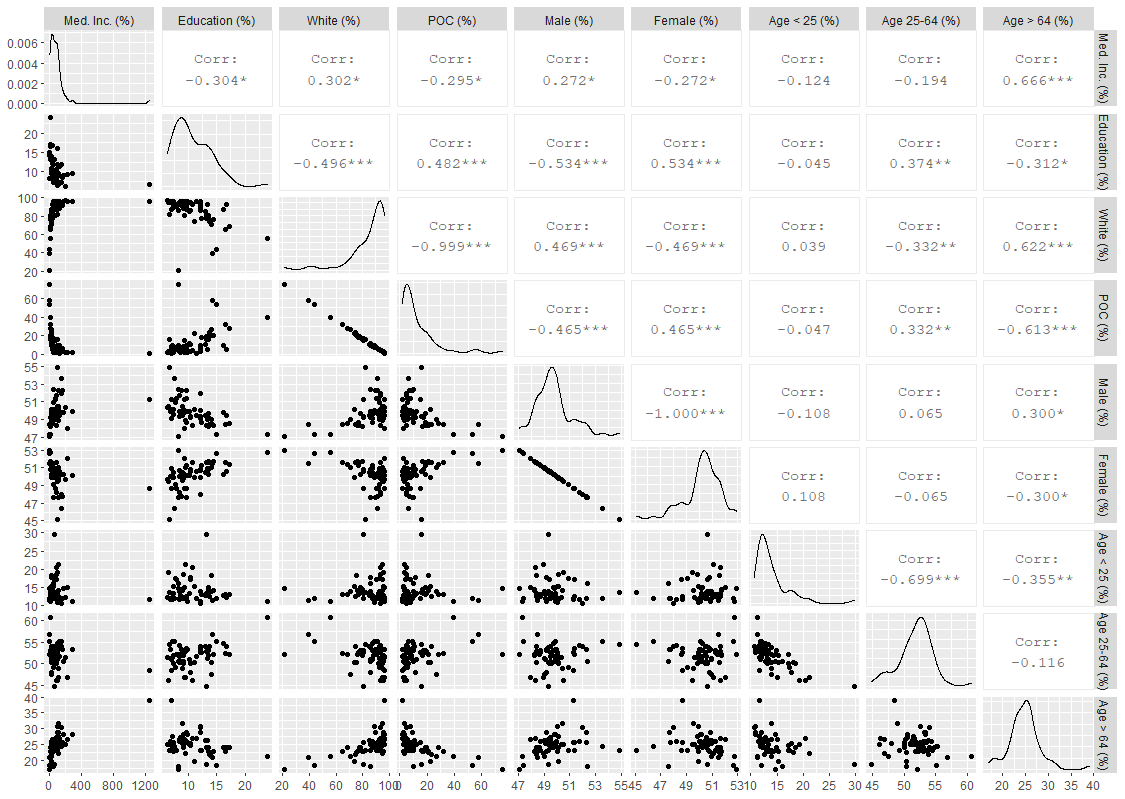
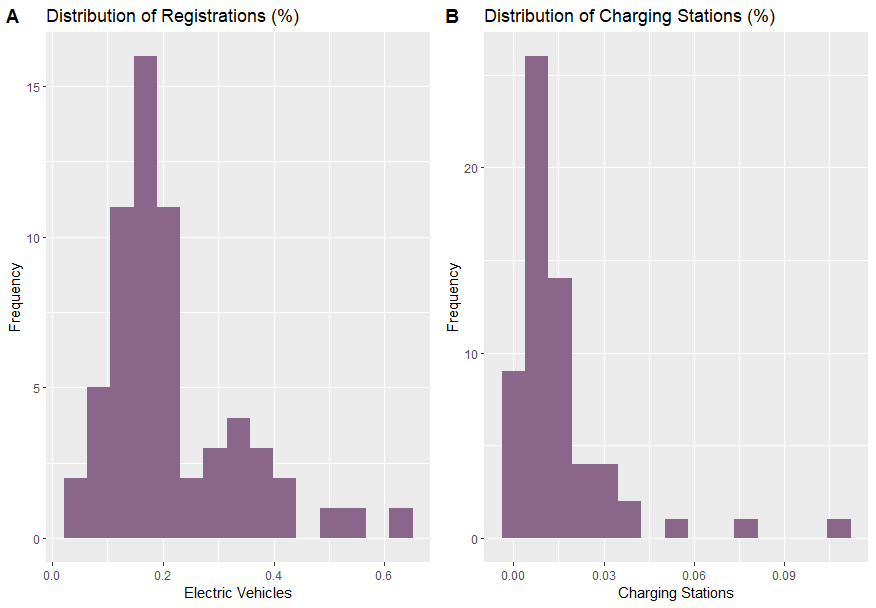
In exploring the correlation and collinearity of census variables, there was a -1 correlation between male and female variables. Therefore only female was utilized in the GWR as one of the two sex variables, whichever being second in the linear model, would result in an NA value. The correlation plot below demonstrates this issue of collinearity. This is similarly observed with the white and person of color (POC) variable, however this correlation is not as strong as the two sex variables and doesn't result in NA values in the model. Additionally, the distribution of EV and CS in NY shows differing distributions and percentage values.
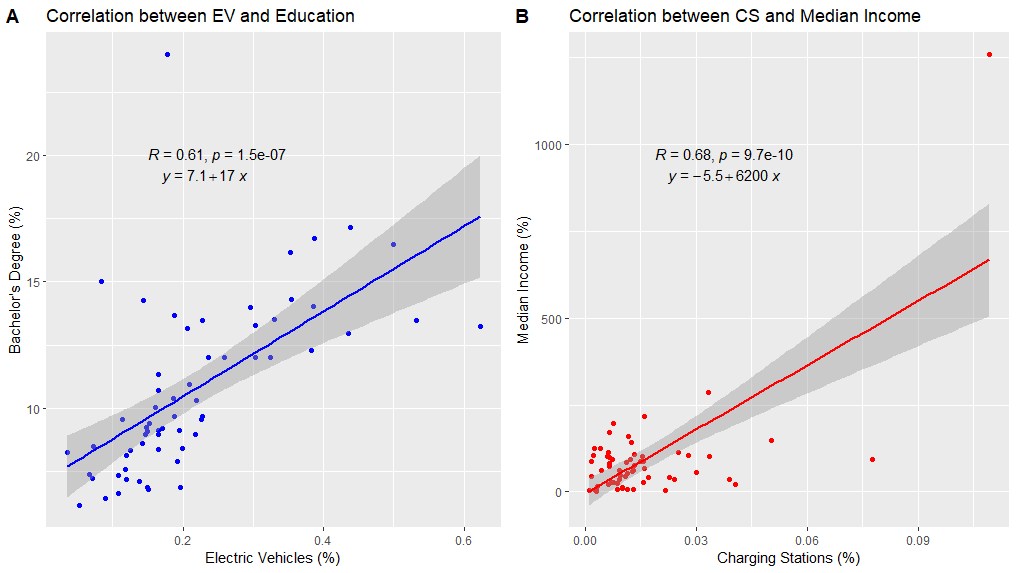
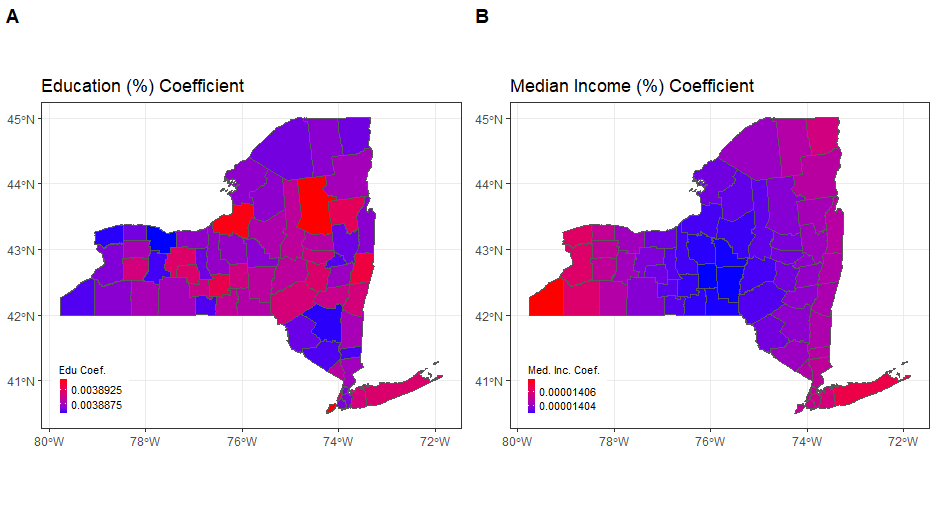
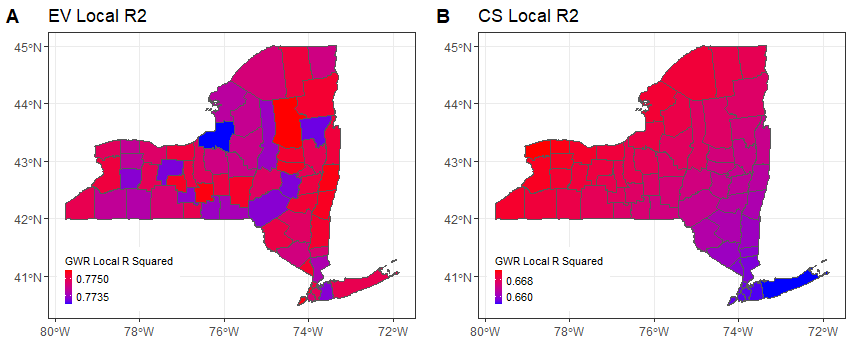
The linear model used for the Geographic Weighted Regressions depicts the statistical significance between the socioeconomic variables and Electric vehicles and Charging Stations. The following coefficients were highly significant for the Electric Vehicle linear model: Education (p < 0) and population density (p < 0) were the most significant followed by people below the age of 25 (p < 0.01), people aged 25 to 64 (p < 0.05), and percentage of Charging Stations (p < 0.05). In the Charging Stations linear model the following variables were statistically significant: Median Income (p<0) was the most significant in the CS model. After people aged 65 and older (p < 0.05) and Electric Vehicles (p < 0.1) were significant. The correlation of the most significant coefficient in their respective GWRs are plotted as a graph and map below. The final GWR maps of Local R2 are also mapped below.
Discussion:
The varying percentages and distribution of Electric Vehicles and Charging Stations across New York State indicates a need to reduce this gap. An adequate number of charging stations should be available and accessible to those with Electric vehicles. The New York analysis finds that education and population density are influencing factors towards owning an Electric Vehicle. Areas in which the population is more educated, through having a Bachelor's Degree, are more likely to have a higher percentage of the population owning Electric Vehicles. In contrast to the EV analysis, median income was the most correlated to the presence of Charging Station sites, however unlike the correlation between EV and education, median income and charging station correlation points are concentrated at lower values. This is represented in the Correlation graph in the NY results. Local R2 results show higher correlation between the variables and EV at less populated areas, while slightly lower correlations are found at more populated counties. Interestingly, the Charging Station Local R2 depicts a gradient-like output with southern counties in NY state having lower R2 values than its northern counterpart.
Code:
Please feel free to contact me through my LinkedIn Account below.